Metrics and alerts for logs 
This guide shows how to use Loki metrics for monitoring log patterns and creating alerts.
Monitoring error rates using log metrics 
To monitor error rates using the loki:service:loglevel:count1m metric:
-
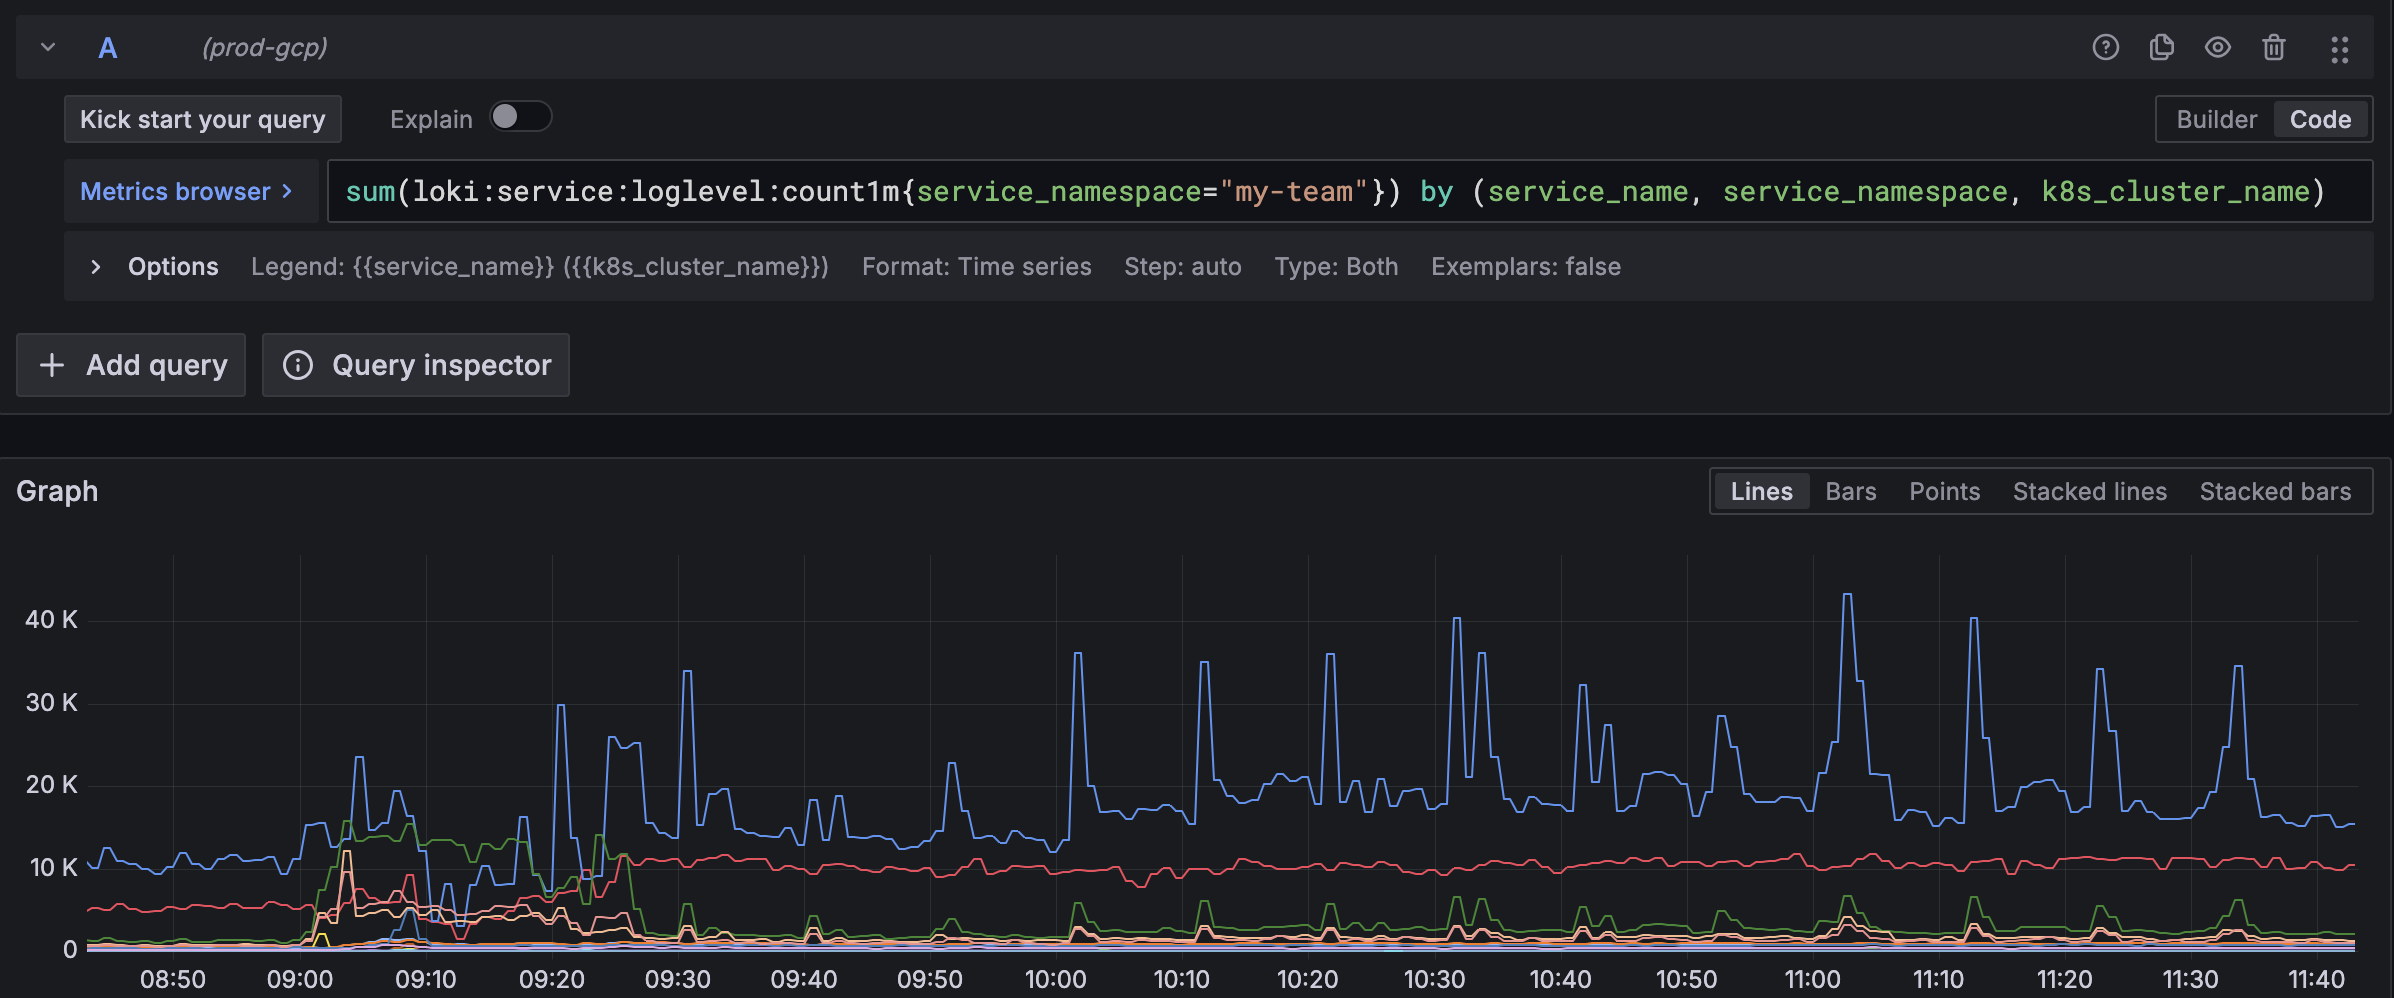
Access Grafana and create a new panel
-
Use this PromQL query to calculate error percentage:
promql100 * sum(loki:service:loglevel:count1m{service_namespace="my-team", service_name="my-app", detected_level="error"}) by (service_name, service_namespace, k8s_cluster_name) / sum(loki:service:loglevel:count1m{service_namespace="my-team", service_name="my-app"}) by (service_name, service_namespace, k8s_cluster_name)Important: The
loki:service:loglevel:count1mmetric is already pre-aggregated for 1-minute intervals. Do not userate()orincrease()functions with it. -
Configure visualization as a graph or gauge
Common log monitoring queries 
Monitor high error volume:
promql
sum(loki:service:loglevel:count1m{service_name="my-app", detected_level="error"}) > 50Show trends over time:
promql
sum(loki:service:loglevel:count1m{service_name="my-app", detected_level="error"}[60m:1m]) by (service_name)Compare error rates across clusters:
promql
sum(loki:service:loglevel:count1m{service_name="my-app", detected_level="error"}) by (k8s_cluster_name)Creating Prometheus alerts for logs 
To create an alert for high error rates in your logs, add a PrometheusRule to your application:
yaml
apiVersion: monitoring.coreos.com/v1
kind: PrometheusRule
metadata:
  labels:
    team: my-team
  name: log-error-alerts
  namespace: my-team
spec:
  groups:
  - name: log-error-alerts
    rules:
      - alert: HighErrorLogRate
        expr: |
          (
            sum(loki:service:loglevel:count1m{service_name="my-app", detected_level="error"})
            /
            sum(loki:service:loglevel:count1m{service_name="my-app"})
          ) > 0.05
        for: 10m
        annotations:
          summary: "High log error rate detected"
          consequence: "Users may be experiencing errors when using the application."
          action: "Check logs for error messages and investigate affected services."
          message: "Service {{ $labels.service_name }} has {{ $value | humanizePercentage }} error logs over the last 10 minutes."
          runbook_url: "https://github.com/navikt/my-app-runbook/blob/main/HighErrorLogRate.md"
        labels:
          severity: warning
          namespace: my-team